Numerous and Strong Hurricanes Expected in 2010

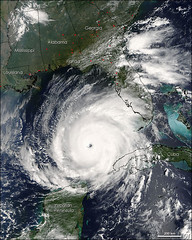
Hurricane Rita by alpoma High sea surface temperatures combined with weakening El Niño conditions are expected to cause a significant increase in the number of hurricanes as well as hurricane intensity in the 2010 season. According to analysis from the UK Hadley Center, sea surface temperatures in the Main Development Region (the area of the Atlantic where most hurricanes are formed) were 1.26°C above average last month, setting a new record for the month of March.

Last week, researchers at Colorado State’s Tropical Meteorology Project, one of the most respected groups in the field, released their predictions for the 2010 hurricane season. They predict fifteen named (or major) storms, eight of those becoming hurricanes, four of which will grow to category three or higher. The predictions are significantly higher than the averages for 1950 to 2000, of 9.6 named storms, 5.9 hurricanes, and 2.3 hurricanes greater than category three. They also project the Accumulated Cyclone Energy, a measure of named storms’ potential to cause damage, to be 56% higher than the 1950-2000 average.

City Council to receive recommendations from Climate Congress

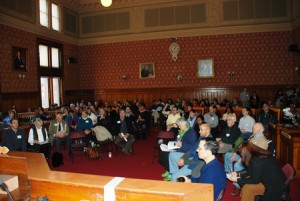
After three community meetings, the Cambridge Climate Congress finalized its recommendations for an all-city awareness and response campaign, and for city responses to the Climate Emergency.  The City Council will receive the Climate Congress communication at the upcoming March 22nd City Council meeting.  This would be an opportunity for the public to provide additional comments on the Climate Congress report and activities.
Continue reading

Seasons of Change

Four Seasons - Longbridge Road by joiseyshowaa A reader submitted this link regarding a traveling exhibit dubbed “Seasons of Change” about global warming’s impact on New England. You can find it at the Ecotarium in Worcester through May, where you might also enjoy an Inspiring Breath of Spring! and other exhibits. Eventually, it will be accessible via public transportation at the Museum of Science, but not anytime this year.

Continue reading

Remember the rainforest?

Logging in PNG by Greenpeace Esperanza The poster child of human environmental destruction in the 90’s is still imperiled, even if the focus has shifted to global warming. Of course the two are intimately related, and besides the forests’ huge impacts on local watersheds—effectively creating their own rain—the forests’ trees and soils obviously have a major impact on the carbon cycle. Still, the onslaught upon the lungs of the world is not only unrelenting but expanding. Continue reading

Extreme documentaries

Are there cars in heaven? by eqqman

Last week’s episode of NOVA Extreme Cave Diving was an interesting foray into “blue holes,” and the evidence they offer of paleo-climate. If you missed it, check the website to view it online. Similar, though less-breath taking evidence is offered in a recent paper from Yale.

This week’s Extreme Ice, provides a stunning and more in-depth review of the photographic documentation of glacial melting by James Balog, which we have mentioned before.

CEA debuts Climate Change Art Project

Climate Change New England

The Cambridge Energy Alliance is debuting a poster art exhibit to inform the public about climate change and its impacts, the carbon emissions of Cambridge, and how local citizens can make a difference. Over 80% of Cambridge’s Climate emissions come from residential and commercial buildings, so eliminating wasted energy in our homes and workplaces is a priority.

To view the full CEA art poster exhibit visit:

http://cambridgeenergyalliance.org/wp-content/uploads/posters.pdf

The Cambridge Energy Alliance art exhibit displays many ways people can conserve energy and get connected to efficiency programs and resources. The Exhibit will be on display from Wednesday, February 16th, 2010 through March 20th, 2010 at the Clear Conscience Café (C3) located inside Harvest Coop‘s Central Square location.

Following the 4-week showing at C3, the CEA art exhibit will be rotated to other locations throughout the city. You can preview the posters by clicking the thumbnail above.

Even with ‘Copenhagen,’ toasty times ahead

Relative emissions graph

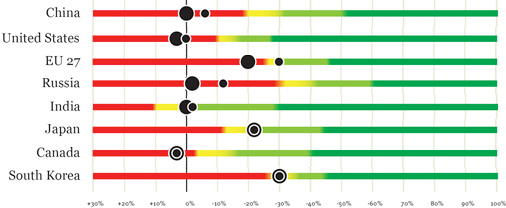
Last week I wrote about the post-COP15 emissions target deadline that whizzed by for most of the planet, and tried to put it into context. Of course, the larger question of what the resulting cuts would mean with regards to future warming remained unanswered, due to it being written during the wee hours of the morning. Fortunately, someone else also crunched the numbers and compared them to model predictions, New Scientist reports, arriving at a most unfortunate (but unsurprising) answer.

Cambridge to host 3rd Climate Congress

EarthA third Climate Congress will be held on Saturday, March 6, 2010, from 9am to noon, in City Hall. The Climate Congress is open to the public. The main aim will be for delegates to unite on specific recommendations for City action. The Congress will use the opportunity to decide on whether to accept a final report on proposals and to bring the new citizen action teams together.

During the second Climate Congress, 75 delegates convened to develop recommendations to the city for addressing climate change, but also organize and develop citizen generated solutions.  Highlights from the second congress include:

  • The Congress discussed priorities among the proposals in the Draft Report. Several common themes emerged and these will be documented in the final report of the Congress.
  • Delegates formed action teams to work in specific areas: outreach, resilience, solar and other renewables, process for future climate emergency response (drafting), protection of trees and natural resources, building efficiency, and measurement . Several of these groups have already agreed to meet again. (If you are interested in participating in any of these groups contact Joanna Herlihy <joanna_herlihy@yahoo.com>)
  • Recommendations for climate emergency response by the City were considered and received broad support. However, there were questions about the specifics and report structure, that required more time to consider. Those present unanimously agreed to meet again for a third session to address those questions.

For more information about the climate emergency and the Climate Congress visit: http://www.cambridgema.gov/deptann.cfm?story_id=2457&pv=Yes

See also previous coverage I & II.

55 countries down…?

There’s a lot of press today about the fact that 55 countries have submitted emissions reduction pledges to the U.N. as the deadline drew passed; note that 27 of them are in the EU. New Scientist has a nice summary, and Reuters India lists most of the targets.

Some of the more disappointing targets include our own, our neighbors to the north, and Korea. “The US previously pledged a cut of 17% from 2005 levels by 2020 (equivalent to 3% from the conventional baseline of 1990)” (BBC). True to its word, the increasingly conservative Canadian government submitted the same relative target as the U.S. South Korea—whose emissions have more than doubled since 1990—has committed to an even smaller cut of 4% of 2005 levels. However, it has tries to play up the significance of these cuts by calling them a 30% cut from business as usual.

Below you can find a summary of the pledges of the top eight emitters (78%) of carbon dioxide, and what their effect might be. Please note that barring an international agreement in Mexico next winter, China and India’s targets are even less firm than those of other nations since they have vowed to decrease intensity (increase efficiency) by 40-45% & 16-20% respectively, rather than make cuts towards a specific target. These estimates are therefore a best case scenario under the unlikely condition of zero future growth.

Baseline2007% GlobalCut2020
MT CO2YearMT CO2MT CO2
1China6083.020076083.027.57%40.00%3649.8
2U.S.5857.120055853.526.53%17.00%4861.4
E.U.4135.419903971.118.00%20.00%3308.3
3Russia2302.619901579.07.16%20.00%1842.1
4India1369.920071369.96.21%16.00%1150.7
5Japan1069.419901235.15.60%25.00%802.1
8Canada543.42005540.82.45%17.00%451.0
9South Korea361.42005499.02.26%4.00%346.9
World200729320.016.09%24600.9

MT = megatonne. approximately 2.2 billion pounds.
Countries 7 & 8 are the United Kingdom and Germany, both members of the European Union.

Sources: Emissions data, and pledges from stories linked in this post.