About LGlick

Lilah was was the Global Warming/Clean Energy Outreach Coordinator for Clean Water Action’s Boston office where she advocated for climate and energy policy in the commonwealth and worked in local communities to promote renewable energy and energy efficiency solutions. Prior to serving as a clean energy advocate, she worked as a Development Associate for a non profit Internet Service Provider to promote low income/ rural access to wireless services. She also served for two years as a Peace Corps volunteer in Nicaragua as a small business coordinator and as an Americorps Community Organizer for the city and school district of Falls City, Oregon.

Did Cash for Appliances Work?

Graph of the how long each state's rebate program ran before allotted funds were spentIt’s a huge success. It hasn’t gone anywhere. Actually, it’s a little of both.

Fifty states and six territories have launched “Cash for Appliances” programs since late last year. Each one had the same amount of money – about a dollar per resident – but the results have been wildly different. Some states ran through their entire rebate budgets in hours; others can’t seem to give away their money. What’s been going on?

Cash for Appliances, modeled on (or at least nicknamed after) last year’s “Cash for Clunkers” program, was funded as part of the $787 billion stimulus bill. Unlike “Cash for Clunkers”, the appliance rebate program wasn’t designed and administered by the federal government. Instead, the government directed $300 million to the 50 states (plus DC and several American territories), at a ratio of roughly $1 per person in each state. Each state then had the opportunity to design their own program within the general guidelines given by the government.

As you’d imagine with a lot of cooks in the kitchen, no two states designed their rebate program in the exact same way: rebate amounts, categories, eligibility, application processes and marketing plans have all differed. As have the results… Ten states had crushing consumer demand that caused them to run out of rebate funds within 4 days of the respective program start dates, with complaints of flooded call centers and crashing websites. Thirteen other states still have desperate operators standing by and literally can’t give away their money.

Comparing State by State Rebate Programs

It’s not just a matter of some states having better deals than others. Take, for example, refrigerator rebates in Massachusetts, Minnesota and California. The programs in all three states offered $200 rebates on efficient refrigerators. Massachusetts and Minnesota “sold out” in 1 day and 2 days respectively. California? Same rebate amount, but the program has been open since April and still has $19 million in rebates unredeemed.

Across the country, the rebate categories and amounts are all over the board:

CategorySmallest State RebateLargest State Rebate
Refrigerators$50$700
Clothes Washers$35$800
Freezers$25$600
Dishwashers$25$400
Air Conditioners$20$1,075
Furnaces$100$2,000
Heat Pumps$75$2,000
Water Heaters$100$1,400
Solar Water Heaters$150$1,200
Boilers$100$1,200

So what attributes matter the most when it comes to determining whether a state program sells out quickly or not at all? The answers aren’t as straightforward as you’d think. We did some analysis to compare each of the programs to see what predicted their likelihood to sell out.

What Doesn’t Matter

Average Electricity Rates: One of the biggest surprises in analyzing the state by state rebate data is that the average price of electricity in a state has almost no impact on how popular its Cash for Appliances program is. Consumers don’t seem to be thinking about this program in terms of its ability to save them money over the long-term – otherwise, we’d expect to see that the states with much more expensive electricity selling out their rebate programs much more quickly than those that have relatively cheap power.

Non-Appliance Rebates: There are the “shiny” appliances (refrigerators, washers, freezers and dishwashers), and then there are the “boring” systems (air conditioners, furnaces, heat pumps, water heaters, boilers and solar water heaters). There’s almost no correlation between the number of “boring” categories that a state has rebates for, or the maximum amount of any of those rebates, and the speed at which the state has gone or is going through their Cash for Appliances budget. While we haven’t seen break-downs for many states in terms of the numbers of each type of rebate that have been redeemed, this result indicates that most people aren’t being motivated by the number or dollar figures of non-appliance rebates.

What Matters a Little Bit

Number of “Shiny” Appliance Rebate Categories: There are four basic appliance categories where states can offer rebates (refrigerators, freezers, dishwashers and clothes washers). Generally speaking, the states that offer rebates in 3 or 4 of those categories are more likely to have run through their rebate dollars quickly than those that have offered rebates in fewer appliance categories.

The fact that states that offer smaller rebates on a broader set of appliances have handed out their money faster than states that offer larger rebates on fewer types of appliances may mean that rebates aren’t successfully channeling consumers into buying specific appliances, but rather “catching” buyers who were already planning purchases.

In Pennsylvania, for instance, there are no rebates on “basic appliances”. All the rebates being offered in that state are for the behind-the-scenes systems for heating water and air (furnaces, boilers and water heaters) –systems in the home that utilize far more energy than kitchen and laundry appliances. And yet, Pennsylvania is one of the “slowest” states utilizing their Cash for Appliances money: of their $11.9 million, they’ve only given out $2 million as of early July. Does that mean that Pennsylvania is failing in their “Cash for Appliances” program? As an economic stimulus, it has clearly not injected as much activity as other “fast” states. But in the longer term, its rebate program should save Pennsylvanians more money than states using their money on appliance rebates only – saving more kWh per rebate dollar spent – if homeowners would just use the program!

Highest “Shiny” Appliance Rebate Dollar Amount: If you exclude several outlying state programs, where very large appliance rebates are provided but only to low-income (Kansas, Oregon) and disabled (Alaska) residents, there’s some correlation between the dollar amount of the largest appliance rebate and how quickly the program dollars ran out, though not nearly as much as whether a program required reservations.

What Really Matters

“Do you have reservations, sir?”: The number one predictor of whether a state rebate program sold out quickly didn’t have anything to do with how generous the rebates were. It actually turned out to hinge on the program’s design. Virtually all the “fast” states required consumers to pre-reserve a rebate application before making a purchase. These states set up websites and call centers that “opened” at a certain date and time, creating an “event” that turned into a feeding frenzy of activity, before closing down within days, or even hours.

Think of the lines around the block at your local Apple store each time a new version of the iPhone comes out. With the iPhone 4, everyone was just standing in line for a reservation! Do you really think Apple’s product marketers could have been taken by surprise by consumer five times in a row (4 iPhone versions and the iPad)?

Ten of the 17 “fastest” states required consumers to reserve a rebate before purchasing a qualifying appliance. Six others had hybrid programs where consumers could either reserve ahead of time or get the discount at the point of sale (if available). Of the 15 “slowest” states, 11 have no reservation system, and three others have optional reservation systems. Basically, all the “slow” states use mail-in rebates after purchase.

Conclusions

For consumers, there’s not much more to say than to give the advice to make calculated, rational decisions about the upfront cost of energy efficiency measures, the available rebates and the 3-5 year payoff. Of course, it’s been pretty well documented in recent behavioral economics research that most consumers don’t behave rationally. So, how about this? At least make sure that you’re aware of all the state, utility and federal energy rebates and tax credits that you can “stack” together and pay for your projects. And, if you’re not sure which projects are the best investment, EnergySavvy has an online energy analysis tool to help you figure it out.

For rebate program designers in government, utilities or manufacturers, there are a few lessons that can be taken away from the Cash for Appliances results:

  1. Create demand through scarcity by requiring pre-reservation for new rebate programs. For rebate programs like Indiana and Pennsylvania (and like many utility rebate programs across the country), that only pay out non-appliance rebates, a potentially effective strategy to kick-start demand would be to re-launch the program with higher rebates for the same back-end measures, but require consumers to pre-reserve their rebate on a specific launch date.
  2. Bundle “shiny stuff” (basic appliances) and “boring stuff” (HVAC systems) together to increase the uptake of less exciting, but greater energy saving, systems.
  3. Catch the “already upgrading” crowd by offering rebates on a wide set of categories but only on the most efficient models in each category. The program may not be stimulating purchases that wouldn’t have happened already, but it can nudge consumers to the highest efficiency products in each category.

The data from the Cash for Appliances program results fit with academic research on consumer behavior.

“The variable rates of uptake based on seemingly trivial factors such as creating a sense of urgency are further evidence that, when the goal is to encourage consumers to act in their best interest, giving them some reason other than pure rationality can be surprisingly effective,” said Michael I. Norton, Associate Professor of Marketing at Harvard Business School, “Inserting some excitement into behaving well – in some sense, copying the way parents induce their children to eat their vegetables via airplane noises – should always be an important consideration for policymakers interested in encouraging behavior change.”

For more information on this report and analysis, contact Scott Case at EnergySavvy.com.

Entire City of Boston to be Scanned for “Energy Gushers”

IR scan of a local home
Big news coming out of Boston this week. Last Friday, the Wattzy team had the opportunity to join Mayor Tom Menino and MIT Projessor Sanjay Sarma for an historic announcement – the entire City of Boston is to be scanned in infrared.

Infrared scanning is nothing new in the world of single-family homes, as any energy efficiency pro can tell you. Utilities like NStar even offer home infrared scans at free or discounted cost. They are highly effective at identifying areas of home heating inefficiency. Although commercial services have offered wide-area aerial scans for some time, this will be the first complete street-level scan of a major city.

If any place can use a city-wide scan, it certainly is Boston. Our housing stock is some of the oldest in the country, which means a huge opportunity for energy savings. The Boston Climate Action Leadership Committee estimates that Boston business and residents “could save more than $2 billion over 10 years” through basic weatherization.

It was no coincidence that this historic event took place at the offices of Next Step Living, a leading Boston-based contractor that provides energy efficiency services directly to homeowners.

Contractors like Next Step Living “are the energy drillers of the clean-tech era,” said MIT Professor Sanjay Sarma. “Instead of the Gulf, they are drilling for energy savings in our homes. This infrared technology is for prospecting.” Professor Sarma is widely credited as the technology visionary behind the foundation of the commercial RFID industry.

Continuing with the “Drill, Baby! Drill!” theme, Galen Nelson, the Boston Redevelopment Authority’s green tech business manager said, “The American home is often referred to as the Saudi Arabia of energy efficiency. There’s so much to be capped.”

In addition to developing the infrared technology to scan every square foot of Boston from the aircraft and street level, Professor Sarma isn’t afraid to put his money where his mouth is. He displayed an infrared image of his home pulsating with red highlights from excessive heat loss. A still version is show above.

“An Energy Gusher,” Professor Sarma said, “and a huge opportunity.”

We at Wattzy certainly agree! The opportunity to save with energy efficiency can indeed be huge.

That’s why Wattzy provides Professor Sarma and all residents of the City of Boston with an easy way to estimate and track their savings from energy efficiency projects.

Home Energy Retrofits Outperform Microsoft

Home energy efficiency retrofits in Boston have a 39 percent return over five years compared to Microsoft's 7 percent.

Times are tough. If you’ve been unemployed in the last few years, your savings have probably dwindled as you’ve struggled to make ends meet. If you haven’t lost your job, then you’ve hopefully been saving and investing small amounts. But the stock market has been a mess over the last five years, and interest rates for CD’s and treasury bonds are tiny.

If you’re fortunate enough to have money to invest, where should you put your money to guarantee a good return?

Here’s a new investment idea for you: a home energy retrofit. Make your home more energy efficient through low-tech and cost-effective measures like insulation, furnace replacement and sealing your heating ducts.

Huh? Why put money into your house with home prices going the way they’ve been. Well, this isn’t about increasing the resale value of your home: though you can expect that it will at least help. All you really need is to live in your home for five years for this to work in your favor due to the lower utility bills you’ll see every month.

To illustrate the impact of doing a home energy retrofit as an investment, here’s a simplified example.  Let’s say five years ago, a homeowner in Boston named Diane was deciding between buying $10,000 of Microsoft stock as an investment and spending that same amount of money on a home energy retrofit to reduce her utility bills.  What would have been the better five-year investment?

The Microsoft stock worth $10,000 in June 2005 would have turned into just $10,700 five years later (a return of 7 percent over five years), including the increase in stock price and the dividends paid out over the course of the five years. But it turns out that the home energy retrofit would have been the much better investment.  If Diane had spent $10,000 on a retrofit for her 2,000 square foot home in Boston, including attic and wall insulation, sealing and insulating ducts, and air sealing her home to eliminate drafts, the investment would have returned 38 percent over five years, in terms of lower utility bills and increased resale value: even assuming that she only gets back half of the value of her investment at the end.

So…  Retrofitting your home is a better investment than the stock market. And that doesn’t even consider the fact that you’ll be more comfortable in your home and you’ll help reduce our country’s dependence on foreign energy sources.

If you’re interested in learning more about how to do a home energy retrofit, who to do it, and how to get as much of it paid for by your utility and the government, estimate your home efficiency then request an energy assessment for a report with recommendations and expected paybacks.

Peabody Terrace Competition Results

On March 6th, 84 residents at Peabody Terrace participated in an incandescent light bulb swap for compact fluorescent bulbs. Residents received one free CFL for every incandescent bulb they turned in—over 200 efficient CFLs found homes. The CFLs were provided by the Cambridge Energy Alliance and Harvard Real Estate Services (HRES). HEET, CEA, and HRES organized the promotion and logistics of this successful competition.

During the swap, residents learned about other ways to cut their carbon emissionsseasonable tips also available—and many signed up for a two-month long competition to see who can reduce them the most.

The results are in!

  • Apartments reduced their electricity use by an average of 11%
  • The top six winners reduced their electricity use by 30%
  • And the first place prize winner reduced electricity use by 58%

Winners received several enticing prizes including Smart Strips; credit at Zip Car; and gift certificates/cards from Clear Conscience Café, Shaw’s and Harvest Co-op Market.

China Cleans Up

Vacuum Solar Tubes China
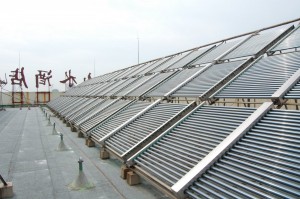
China exceeded U.S. investment in clean energy for the first time last year with deployments totaling $34.6 billion. The country still has a long way to go to clean up it’s emissions—China surpassed the US as the global leader in C02 emissions several years ago—but they’re moving quickly to clean up their act.

Technology Review posted a slide show today profiling some of the new technology they’re committing to including offshore wind, utility-scale solar power, DC transmission lines, massive nuclear deployments, and coal with carbon capture and sequestration.

I was happy to see vacuum tube solar hot water included in Tech Review’s lineup. Not the most cutting edge technology, but one in ten Chinese people now use these highly efficient heaters for domestic hot water.

Getting Agreement on Energy Policies and Plans

Energy planning ought to be about avoiding problems and seizing collective opportunities. Cities (and nations) have problems when there is not enough energy available at a reasonable price. And, if they could get their act together, cities, regions, states and countries could reduce wasteful patterns of energy use and take advantage of “greener” energy production technologies that reduce costs of all kinds—especially environmental cost—and increase energy independence (i.e. reducing our dependence on “foreign” oil). Energy planning is about figuring out the best way to match energy supply and energy demand in sustainable ways. It gets complicated, though, because different groups have their own ideas about (1) the desirability of relying on various sources of energy; (2) the desirability of relying primarily on markets to set prices, encourage technology innovation and meet long-term needs, and (3) the appropriateness of allowing some groups and countries to tightly control certain energy supplies. In the final analysis, negotiations at the international, national, state, regional and local levels determine which energy supplies are available and what price we pay to meet our growing demand for electricity, transportation, home heating, and economic production.

Imagine a pie chart that shows the composition of our current energy supplies. We can do this at any scale. Let’s think about the country as a whole. Coal, oil, natural gas, nuclear energy, renewables (like solar and wind power), and a few other sources each constitute a wedge. A similar-sized pie chart shows how we use energy: industrial uses, residential uses, transportation, commercial uses, and the like. Supply and demand must be in balance in the sense that we can only use what we are able to find and pay for.

If you ask what the supply and demand pie charts will look like at a certain point in the future, say 10 years from now, there is no correct answer. Different groups will prefer a different mix of energy supplies and want to reshape energy demand, either because a shift will benefit them directly or because they are committed to improving the net overall impact on society in some way. One thing is for sure, though, experts can’t tell us what the pie charts ought to look like. We have to make those decisions for ourselves.

If it were up to you, how would you want to alter the pie charts for the United States? The current supply is made up of about 29% coal, 16% oil, 31% natural gas, 12% nuclear, and 11% renewables (including hydro). Current demand includes 30% industrial, 22% residential, 28% transportation, and 19% commercial. The overall price of energy is just over 9 cents per kilowatt, although not everyone pays the same price. The environmental costs of current energy use and production are hard to calculate. Sometimes these are framed in terms of impacts on public health: x people die or get sick each year from diseases associated with pollution of various kinds caused by energy production and utilization. Increasingly environmental costs will be framed in terms of what we would have to spend to artificially do the work that ecosystem do naturally like filter air and water or convert CO2 to oxygen. These are called ecosystem services and we can price them.

Any change in the overall size of the “pie” will effect certain groups—either changing the price they have to pay for a unit of energy, redistributing job opportunities, reshaping environmental costs, or altering the balance of power in the world. Someone’s got to pay for investments in new technology if we want to grow the pie or change the size of a supply or demand wedge.

Efforts at present, at the city level for instance, to change the pattern of energy supply and demand include (1) reducing the amount of energy used by municipal governments; (2) encouraging individual homeowners and businesses to conserve energy and reduce their carbon footprints; (3) encouraging more energy efficient patterns of land use and development, and (4) looking for ways to encourage more sustainable electricity production (through re-use of brownfields for renewable energy, building trash-to-energy plants and the like). In a big city, these can have a noticeable effect. Overall, though, states and national governments will have to get involved or the larger pie charts won’t look very different in the future than they do now. In recent years, states have begun to require that at least 20% of the electricity produced within their borders come from renewable energy sources by 2020 or 2030. We’ll see whether these provisions are enforces. If they are, the size of the renewable energy wedge could double in the national supply chart.

Unfortunately, we don’t have proper forums in which we can work out agreements on how existing supply and demand pie charts should look in the future. Congress has never faced this issue directly; preferring instead to make incremental decisions about whether to subsidize one form of energy development or not (often, at one location at a time). As a nation, we have not set supply or demand goals; instead, we have just bumped along. As I mentioned, states have been trying to encourage investment in cleaner forms of energy production, but they are limited by the grid—the system of power lines that allows energy produced and stored in one location to be “wheeled” to other locations as demand ebbs and flows. We need a national plan to expand and modernize the grid. We also need to figure out how to store and distribute highly distributed forms of (renewable) energy. We need to decide whether we are going to maintain or increase our reliance on nuclear energy even if we don’t have a plan for storing high level nuclear waste.

If states try to change energy efficiency standards or subsidize new forms of energy production, they end up competing with each other. Localities are even more highly constrained. They can improve energy efficiency in public buildings, increase the efficiency of the municipal bus fleet and work with building owners to encourage retrofits that reduce the demand for energy. They can also urge residents to use less energy. But, most are not about to get involved directly in producing energy on their own. If we allow more drilling, maybe we can increase our reliance on oil and gas. But, how do we do that and decrease greenhouse gas emissions at the same time? Can we assume that technology innovation (i.e. clean coal technology or carbon sequestration) will resolve that apparent conflict?

What would it mean to create national, state and local forums in which we could negotiate agreements regarding the changes we want to achieve in the current supply and demand pie charts? At each level, we would have to bring together representatives of all the relevant interests groups, engage in joint fact finding (with the help of appropriately qualified experts), formulate comprehensive agreements regarding five, ten and twenty year objectives and commit to appropriate implementation strategies. These conversations would not be easy. It is hard to formulate overall “packages” that will leave everyone better off. Discussions of this sort need to be mediated by qualified consensus building professionals. At the national level, the Department of Energy could take the lead (in cooperation with the appropriate Congressional committees) but a great many other groups would have to be involved. At the state level, governors and legislative leaders could convene appropriate consensus building efforts, but first we would need to figure out how to define the scope of state energy policies and how they fit within certain national decisions. In every city, broadly-representative working groups would need to consider possible changes in their supply and demand objectives within the framework of state and national plans. Final decisions would be made, of course, by those with the legal authority to make them, but to ensure implementation, the trade-offs and shifting distribution of gains and losses would need to have broad political support.

In the end, energy policies and plans are political choices that ought to reflect the best possible scientific, economic and engineering inputs. Our traditional approach to making public policy—careening from one crisis to the next—won’t produce the interlocking decisions required. We need to commit to a consensus building approach to energy planning.

City Council to receive recommendations from Climate Congress

After three community meetings, the Cambridge Climate Congress finalized its recommendations for an all-city awareness and response campaign, and for city responses to the Climate Emergency.  The City Council will receive the Climate Congress communication at the upcoming March 22nd City Council meeting.  This would be an opportunity for the public to provide additional comments on the Climate Congress report and activities.
Continue reading

Go Green Awards Nominations Deadline: April 5th

It is time again for the city of Cambridge’s Go Green Awards, which recognizes businesses and organizations that take exceptional environmental actions in at least one of five areas—energy use, transportation, waste reduction, stormwater, and climate protection. Self nominations are accepted.

Last year’s 2009 award recipient’s included:

Transportation: The Charles Hotel and Irving House

Waste Reduction: Grendel’s Den and Volpe Center

Climate Protection: Genzyme and Citigate Cunningham

Energy: HRI and Cambridge Health Alliance

Stormwater Management: Forest City and Old Cambridge Baptist Church

Community Organization: HEET

The deadline for the 2010 GoGreen Awards nominations is April 5. Use the GoGreen nomination form and submit to: John Bolduc, jbolduc@cambridgema.gov, fax 617-349-4633. The nomination form can be found at: http://www.cambridgema.gov/gogreen.   If you have any questions, contact John Bolduc, jbolduc@cambridgema.gov or 617-349-4628.

Save the date:  The 2010 GoGreen Awards ceremony will be held Tuesday, May 25 at 5:30 pm at the City Hall Annex, 344 Broadway.

Volunteers go door to door in East Cambridge

CFL exchange volunteers On Sunday, February 21, eighteen volunteers participated in a community canvass campaign to spread awareness about simple home improvements to save money, energy, and the planet. The event organized by the Home Energy Efficiency Team and the Cambridge Energy Alliance sought to help cut carbon emissions in East Cambridge through a CFL light bulb exchange.

Exchanging incandescent light bulbs for compact fluorescents is one of the easiest and effective ways to reduce energy use at home. A compact fluorescent light bulb (CFL) will save about $30 over its lifetime and pay for itself in about 6 months. It uses 75 percent less energy and lasts about 10 times longer than an incandescent bulb. If every Massachusetts household would exchange just one incandescent light bulb to an energy saving CFL, it would save enough energy to light all the homes in Boston for 100 days, reduce greenhouse gas equivalent to removing more than 17,000 cars from the road, and save more than $20 million annually in reduced energy costs.

Volunteers exchanged 129 incandescents bulbs for CFLs, saving over 76,000 lbs of CO2 emissions. Volunteers worked together in teams, offered free energy-efficient CFL light bulbs, initiated dialogue about simple home energy-saving tips, and invited folks to participate in an upcoming Community Weatherization Barnraising on February 28th. The Home Energy Efficiency Team will be weatherizing two houses in East Cambridge. Special guest Andrew Ference—Boston Bruins defenseman and avid climate change activist—will be attending this exciting event and making a donation to the New England Grassroots Environment Fund, one of HEET’s funders.

These type of events go a long way to spreading important information about climate change and energy efficiency solutions to people in our communities who may not otherwise receive it. To learn more information about community barnraisings visit HEET’s website.

CEA debuts Climate Change Art Project

Climate Change New England

The Cambridge Energy Alliance is debuting a poster art exhibit to inform the public about climate change and its impacts, the carbon emissions of Cambridge, and how local citizens can make a difference. Over 80% of Cambridge’s Climate emissions come from residential and commercial buildings, so eliminating wasted energy in our homes and workplaces is a priority.

To view the full CEA art poster exhibit visit:

http://cambridgeenergyalliance.org/wp-content/uploads/posters.pdf

The Cambridge Energy Alliance art exhibit displays many ways people can conserve energy and get connected to efficiency programs and resources. The Exhibit will be on display from Wednesday, February 16th, 2010 through March 20th, 2010 at the Clear Conscience Café (C3) located inside Harvest Coop‘s Central Square location.

Following the 4-week showing at C3, the CEA art exhibit will be rotated to other locations throughout the city. You can preview the posters by clicking the thumbnail above.